To measure performance, you might want to know how much does it take to complete the task.
Here are shell script to help you.
The following measure hard disk performance by creating 10 GB file.
#!/bin/bash
START=$(date +%s)
# do something
# start your script work here
dd if=/dev/zero of=/home/user/hd2/file.img bs=1M count=1000
# your logic ends here
END=$(date +%s)
DIFF=$(( $END - $START ))
echo "It took $DIFF seconds"
วันพฤหัสบดีที่ 21 มกราคม พ.ศ. 2553
Nginx / lighttpd light weight web server.
Apache is a standard for web server. But, you can help apache and utilize computing resource by using lighttpd and nginx as a helper for static content/load balancer for your website.
nginx :
http://wiki.nginx.org/NginxModules
lighttpd
http://redmine.lighttpd.net/wiki/lighttpd
nginx :
http://wiki.nginx.org/NginxModules
lighttpd
http://redmine.lighttpd.net/wiki/lighttpd
วันพุธที่ 20 มกราคม พ.ศ. 2553
webserver http-caching header
Here are link to speed up your http server :
http://www.mnot.net/cache_docs/
http://www.web-caching.com/
http://www.mnot.net/cache_docs/
http://www.web-caching.com/
User & group management : uid, gid user
If you share file about variety distro of linux, you might experience with permission error.
The following command help to change uid, gid of user apache group apache to 81 :
#usermod -u 81 apache
#groupmod -g 81 apache
#id apache
The following command help to change uid, gid of user apache group apache to 81 :
#usermod -u 81 apache
#groupmod -g 81 apache
#id apache
Read more:
user & group management : http://www.linux-mag.com/cache/7759/1.html
วันอังคารที่ 12 มกราคม พ.ศ. 2553
How to monitor harddisk with smartmontools
Now let's install the smartmontools package:
# emerge -av smartmontools
Finally, you have to check if your hard disk(s) support SMART:
# smartctl -i /dev/hda
For SATA drives:
# smartctl -i -d ata /dev/sda
Using smartctl
[edit]
SMART Health Status
Let's check the SMART Health Status:
# smartctl -H /dev/hdaIf you read PASSED it's ok, but if you read FAILED you have to backup your data now: the disk has already failed or it's predicted to fail within 24 hours!
To recover from bad block :
http://smartmontools.sourceforge.net/badblockhowto.html
smartmontool document:
http://sourceforge.net/apps/trac/smartmontools/wiki/TocDoc
วันศุกร์ที่ 8 มกราคม พ.ศ. 2553
swappiness tuning linux
vm.swappiness is a tunable kernel parameter that controls how much the kernel favors swap over RAM. At the source code level, it’s also defined as the tendency to steal mapped memory. A high swappiness value means that the kernel will be more apt to unmap mapped pages. A low swappiness value means the opposite, the kernel will be less apt to unmap mapped pages. In other words, the higher the vm.swappiness value, the more the system will swap.
More to read : http://www.linuxvox.com/2009/10/what-is-the-linux-kernel-parameter-vm-swappiness/
The following is the test. It seems that the higher swapiness the slower i/o rate. More to read : http://lwn.net/Articles/100978/
More to read : http://www.linuxvox.com/2009/10/what-is-the-linux-kernel-parameter-vm-swappiness/
The following is the test. It seems that the higher swapiness the slower i/o rate. More to read : http://lwn.net/Articles/100978/
linux memory management
Overview of memory management
Traditional Unix tools like 'top' often report a surprisingly small amount of free memory after a system has been running for a while. For instance, after about 3 hours of uptime, the machine I'm writing this on reports under 60 MB of free memory, even though I have 512 MB of RAM on the system. Where does it all go?
The biggest place it's being used is in the disk cache, which is currently over 290 MB. This is reported by top as "cached". Cached memory is essentially free, in that it can be replaced quickly if a running (or newly starting) program needs the memory.
The reason Linux uses so much memory for disk cache is because the RAM is wasted if it isn't used. Keeping the cache means that if something needs the same data again, there's a good chance it will still be in the cache in memory. Fetching the information from there is around 1,000 times quicker than getting it from the hard disk. If it's not found in the cache, the hard disk needs to be read anyway, but in that case nothing has been lost in time.
To see a better estimation of how much memory is really free for applications to use, run the command free -m:
| Code: free -m |
total used free shared buffers cached |
The -/+ buffers/cache line shows how much memory is used and free from the perspective of the applications. Generally speaking, if little swap is being used, memory usage isn't impacting performance at all.
Notice that I have 512 MB of memory in my machine, but only 52 is listed as available by free. This is mainly because the kernel can't be swapped out, so the memory it occupies could never be freed. There may also be regions of memory reserved for/by the hardware for other purposes as well, depending on the system architecture. However, 360M are free for application consumption.
The difference among VIRT, RES, and SHR in top output
VIRT stands for the virtual size of a process, which is the sum of memory it is actually using, memory it has mapped into itself (for instance the video card's RAM for the X server), files on disk that have been mapped into it (most notably shared libraries), and memory shared with other processes. VIRT represents how much memory the program is able to access at the present moment.
RES stands for the resident size, which is an accurate representation of how much actual physical memory a process is consuming. (This also corresponds directly to the %MEM column.) This will virtually always be less than the VIRT size (there are only very rare cases that they will be equal, and RES will never be more than VIRT).
SHR indicates how much of the VIRT size is actually sharable (memory or libraries). In the case of libraries, it does not necessarily mean that the entire library is resident. For example, if a program only uses a few functions in a library, the whole library is mapped and will be counted in VIRT and SHR, but only the parts of the library file containing the functions being used will actually be loaded in and be counted under RES.
The difference between buffers and cache
Buffers are allocated by various processes to use as input queues, etc. Most of the time, buffers are some processes' output, and they are file buffers. A simplistic explanation of buffers is that they allow processes to temporarily store input in memory until the process can deal with it.
Cache is typically frequently requested disk I/O. If multiple processes are accessing the same files, much of those files will be cached to improve performance (RAM being so much faster than hard drives), it's disk cache.
More to read : http://www.gentoo-wiki.info/FAQ_Linux_Memory_Management
http://forums.gentoo.org/viewtopic-t-175419-postdays-0-postorder-asc-start-0.html
optimize Tortoise SVN cache
From : http://www.paraesthesia.com/archive/2007/09/26/optimize-tortoise-svn-cache-tsvncache.exe-disk-io.aspx
To optimize the disk usage...
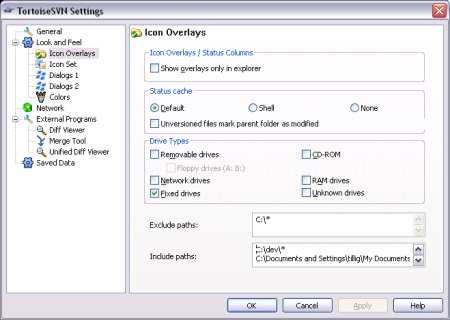
- Right-click on your desktop and select "TortoiseSVN -> Settings..."
- In the tree view, find the "Look and Feel/Icon Overlays" branch.
- In the "Exclude Paths" box, put
C:\*to exclude the entire C drive. If you have more drives than that, exclude them all at the top level. Separate the values by newlines. - In the "Include Paths" box, list all of the locations you have working copies, separated by newlines. Again, this is easier if you keep all of your working copies in a specific folder or set of folders. Using my example, this is what I put in the "Include Paths" box:
C:\dev\*
    C:\Documents and Settings\tillig\My Documents\Visual Studio 2005\*
    C:\Documents and Settings\tillig\My Documents\Visual Studio Projects\*
And here's a screen shot:
- Click OK to apply the changes.
- Either reboot or open Task Manager and kill "TSVNCache.exe" so it restarts when needed. You have to restart it for these options to take effect.
After I did this, the icon overlays still worked great but the disk I/O went down to nearly nothing. YMMV.
วันพุธที่ 6 มกราคม พ.ศ. 2553
Apache Segmentation fault
Recently, I've found the message in
#/var/log/apache2/error_log
[notice] child pid 20295 exit signal Segmentation fault (11)
Getting core dump file : http://www.question-defense.com/2009/07/15/apache-notice-child-pid-27609-exit-signal-segmentation-fault-11
debugin apache : http://httpd.apache.org/dev/debugging.html
Apache document directive for coredump : http://httpd.apache.org/docs/2.0/mod/mpm_common.html
CoreDumpDirectory Directive
| Description: | Directory where Apache attempts to switch before dumping core |
|---|---|
| Syntax: | CoreDumpDirectory directory |
| Default: | See usage for the default setting |
| Context: | server config |
| Status: | MPM |
| Module: | beos, leader, mpm_winnt, perchild, prefork, threadpool, worker |
This controls the directory to which Apache attempts to switch before dumping core. The default is in the ServerRoot directory, however since this should not be writable by the user the server runs as, core dumps won't normally get written. If you want a core dump for debugging, you can use this directive to place it in a different location.
วันอังคารที่ 5 มกราคม พ.ศ. 2553
TCP/networking tunning
Kernel TCP Networking tunning .
You can achieve a high network performance by adjusting some value to to the kernel
From http://www.gentoo-wiki.info/HOWTO_TCP_Tuning
http://blogs.techrepublic.com.com/opensource/?p=62
http://www.freebsd.org/doc/en/books/handbook/index.html
tcp_max_syn_backlog
somaxconn
You can achieve a high network performance by adjusting some value to to the kernel
From http://www.gentoo-wiki.info/HOWTO_TCP_Tuning
http://blogs.techrepublic.com.com/opensource/?p=62
http://www.freebsd.org/doc/en/books/handbook/index.html
Variables to Change, and suggested Values
- net.core.rmem_max="16777216"
- This setting changes the maximum network receive buffer size to 16777216 bytes.
- net.core.wmem_max="16777216"
- The same thing for the send buffer
- net.ipv4.tcp_rmem="4096 87380 16777216"
- This sets the kernel's minimum, default, and maximum TCP receive buffer sizes. You might be surprised, seeing the maximum of 16M, that many Unix-like operating systems still have a maximum of 256K!
- net.ipv4.tcp_wmem="4096 65536 16777216"
- A similar setting for the TCP send buffer. Note that the default value is a little lower. Don't worry about this, the send buffer size is less important than the receive buffer.
- net.ipv4.tcp_no_metrics_save=1
tcp_max_syn_backlog
somaxconn
วันจันทร์ที่ 4 มกราคม พ.ศ. 2553
Hardisk upgrade/Replace
เปลี่ยน ฮาร์ดดิส ให้ลิกนุกซ์
http://www.losurs.org/docs/LDP/HOWTO/Hard-Disk-Upgrade/index.html
http://www.losurs.org/docs/LDP/HOWTO/Hard-Disk-Upgrade/index.html
สมัครสมาชิก:
บทความ (Atom)